NeuroDrift · Markets · the «Snapshot Scan» column · issue 7 October 2026
Snapshot Scan — October 2026: ten oversold, healthy companies where fear exceeds the damage
The index sits at a record while 62% of the watchlist trades 15% or more below its peaks. First issue of the column: where fear, not numbers, is being sold. Ordered by the chance of touching +15% within 84 trading days.
Buy the fear, not the break · 52-week drawdown · health · odds · catalysts · data: close of 6 Oct 2026, 156 PanicRadar stocks
A signal, not investment advice. The probabilities below are model estimates, not guarantees. Half of the list reports within four weeks, and a report can be a catalyst or a new low. The author may hold positions in the securities mentioned. The decision and the sizing are yours.
On 6 October 2026 the S&P 500 closed at a record: $779 for the SPY fund. The same day, 62% of the 156 stocks on the PanicRadar watchlist sat at least 15% below their 52-week peaks, and 40% were down a quarter or more. Semiconductors hold the index up: the SMH fund gained 11.6% in a month. Everything else is being sold.
There are two reasons, and they overlap. First, rates. The 10-year US Treasury yield climbed to 5.3%, a 24-year high, and on 16 September the Fed under its new chair Kevin Warsh raised rates for the first time since 2023. A dollar that costs more over time compresses the multiples of everything that grows long and slow: insurers, banks, medtech, software. Second, agent fear. On 22 September Meta launched Muse, a consumer agent that books flights across 500 airlines and compares deposit rates on its own. Schwab lost 6% that day; Booking and Expedia lost 3% to 8%. Software had already been de-rated in February, after the "AI replaces SaaS" wave.
In this issue we look for companies where both fears are already in the price and the reports show no break: revenue is growing, margins hold, guidance has not been cut. Of 156 names, 47 passed the filters. We dissected 28 of them, each with a bull analyst and three skeptics working different lenses. Ten held up.
Prices fell, forecasts did not: the market repriced the multiple, not the earnings.
01Market snapshot
SPY · 1 mo+1.2 %
QQQ · 1 mo+5.7 %
SMH (semis) · 1 mo+11.6 %
US 10-year≈5,3 %
> 15% below 52w high62 %
pool → healthy104 → 47
This is a rotation, not a sell-off. Money is leaving the names the market has filed under AI victims or rate hostages and moving into those that sell AI infrastructure. The median watchlist stock sits 21% below its 52-week peak and the median RSI is 52: not panic, but long pressure. In a tape like this the rebound rarely comes from the index. It comes from a date: a report that disproves the fear, or a CPI print that lets yields fall.
Two dates matter most. 14 October, September CPI: a hot print keeps multiples compressing even through strong reports. 28 October, the Fed, with the market pricing roughly 80% odds of a pause. In between, banks, Netflix, GE, Vertiv and Deckers report.
02Fear map
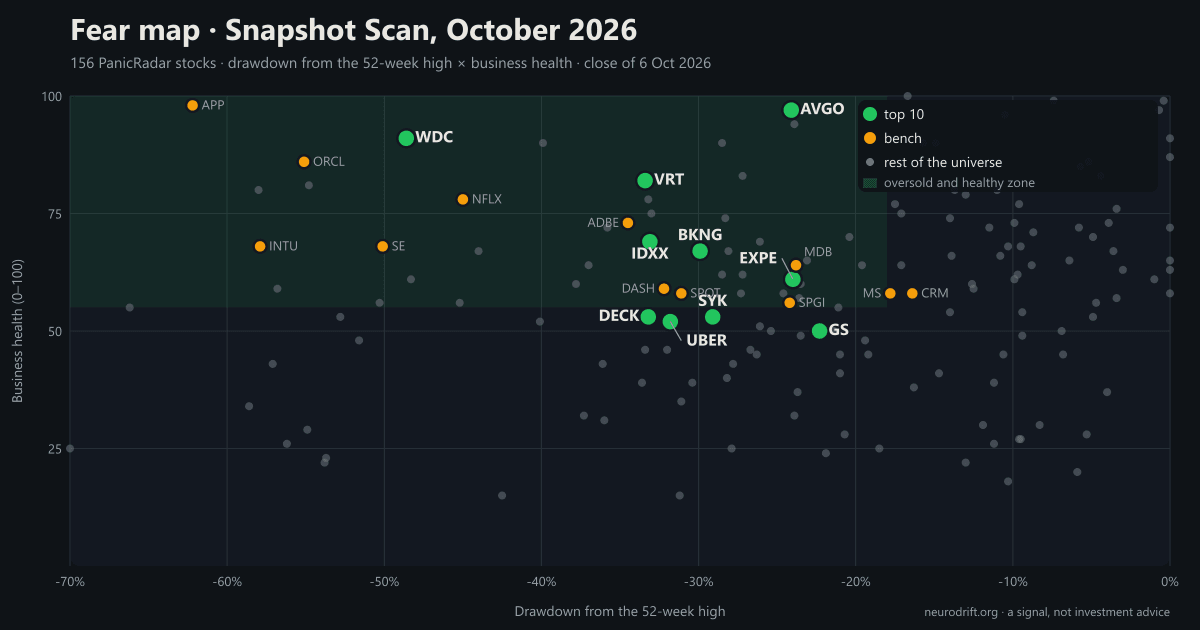
Top right — deeply fallen and healthy. Top 10 and bench are labelled; the rest of the universe is grey dots.
03Top 10: where fear exceeds damage
Horizon
Probability of touching the level at least once over the chosen horizon, given realized volatility and zero drift. Honest mechanics: higher volatility lifts both numbers, +15% and −15%.
all fears🤖 AI agents and robotaxis📈 rates and rotation📰 company news
1VRTVertiv · power and cooling for data centers$253 · -33% from the 52-week high · RSI 50
−33% from 52w highrevenue +24% · EPS +60%guidance raised · net cash32x, a premiumanalysts + skeptics: 35% for +15%
FearOne revenue miss and a pause in AI capex. On 29 July quarterly revenue came in at $3.27bn against an expected $3.38bn; management blamed the timing of multi-phase projects. The stock lost 17% in a day even though earnings beat consensus and guidance was raised. On 6 October GLJ Research opened the first Sell rating with a $188 target.
FactOperating margin 22.6% (+410bp), FCF $925m for the quarter, net cash. Full-year guide raised to $13.8–14.2bn and EPS $6.65–6.75 (+60%). Next quarter guided to +34–36% organic growth. Vertiv is NVIDIA's partner on the 800-volt architecture: the threat is partly its own product. 87% of analysts rate it Buy.
Thesis breakQ3 revenue below $3.65bn (the bottom of the guide) or a cut to the full-year outlook on 21 October. Technically, a close below $222. Skeptics: after the miss the company stopped disclosing orders and backlog, removing the only conversion metric, and the +15% level was already rejected on 8 September.
Touch probability over the horizon · 84 trading days
2WDCWestern Digital · hard drives for AI data centers$411 · -49% from the 52-week high · RSI 41
−49% from 52w highrevenue +44% · gross 54%20x FY27 earnings · no net debtbeta 2.3, volatileanalysts + skeptics: 39% for +15%
FearA third player breaking the oligopoly. On 2–3 October Toshiba announced a doubling of capacity by 2027 with a 30% share target instead of about 10%. The market feared for the pricing discipline on which the entire HDD margin expansion rests. Earlier, on 6 August, the stock fell 13% after a beat with a guide that was merely in line.
FactThe quarter: revenue $3.75bn (+44%), gross margin 54.4% against 43.5% a year earlier, operating margin 44%, FCF $1.28bn. Next-quarter guide $4.1bn at a 55–56% margin. Debt repaid, $2.6bn bought back in a year. Hard drives hold about 80% of the data in cloud data centers, and hyperscaler contracts are written in advance. The strongest overreaction signal in the PanicRadar engine among all 156 names.
Thesis breakA weekly close below $370, or any sign of weakening prices or long-term contract terms on 29 October. Skeptics: 20x is a peak-cycle illusion because it rests on earnings that must double; insiders made 110 sales and zero purchases in six months.
Touch probability over the horizon · 84 trading days
3EXPEExpedia Group · online travel$260 · -24% from the 52-week high · RSI 27
−24% from 52w highRSI 2711.5x P/E · net cash5 straight beat-and-raise reportsanalysts + skeptics: 34% for +15%
FearThe same disintermediation, with a paradox: Expedia is itself a Muse launch partner, and the stock fell 7.7% on launch day. On 16 September Morgan Stanley cut it to Underweight: zero active-user growth in Q2 against +6% at Booking and +10% at Airbnb, and a chain-hotel-and-air inventory it called commoditised.
FactQ2 (5 August): revenue +14%, bookings +12%, the B2B segment +21% for the twentieth straight quarter, EBITDA +23%, EPS +36%, FCF +39%. Full-year guidance raised. 11.5x earnings, 90% gross margin, 6% of shares bought back per year. B2B, supplying inventory to partners, is indifferent to who the consumer interface is.
Thesis breakConsumer-segment bookings below +4% in Q3 or a cut to the full-year guide (revenue below $16.05bn). Technically, a weekly close below $240. Skeptics: the Q3 guide halves to +5–7%, and even a beat may not trigger while agents remain an open question.
Touch probability over the horizon · 84 trading days
Catalyst: 3 Nov — Booking's report (read-through); 4–5 Nov — Q3 report
4AVGOBroadcom · AI semiconductors$376 · -24% from the 52-week high · RSI 59
−24% from 52w highrevenue +86% · AI semis +221%46% FCF marginhealth 97, the highestanalysts + skeptics: 34% for +15%
FearCircular financing. On 1–2 October Anthropic's IPO prospectus revealed that Broadcom will lend the customer up to $42bn in convertible notes, roughly a year of free cash flow. The market read it as a two-company concentration and a conflict of interest. Earlier, on 2 September, the quarterly guide fell $0.2bn short of consensus and gross margin slipped to 73% on memory content in the chips.
FactQuarterly revenue $29.6bn (+86%), AI semiconductors $16.7bn (+221%). Full-year AI revenue guidance raised to about $58bn, next year a doubling to about $115bn with named contracts: Anthropic, OpenAI, Meta, Google. On next year's earnings the stock trades at 19x. The structural skeptic found nothing to refute.
Thesis breakA close below $335 (under the 1 October low), hyperscaler capex cuts in late October, or management walking back the $115bn target. Skeptics: on current-year earnings this is 32x, not 22x, and the last two reports sold off even on beats.
Touch probability over the horizon · 84 trading days
Catalyst: late Oct — hyperscaler capex; mid-Nov — Anthropic IPO; ≈9 Dec — report
5UBERUber · mobility and delivery$69.08 · -32% from the 52-week high · RSI 42
−32% from 52w high15.6x P/E · FCF above $10bnCEO bought about $10m of stock$17bn of M&A, a burdenanalysts + skeptics: 25% for +15%
FearRobotaxis will bypass the platform and agents will bypass the app. On 8 September Tesla showed the Cybercab in Austin, Uber fell 4%. On 22 September, Muse. On 6 October the company announced the $2.3bn purchase of ezCater on top of the $14.8bn tender for Delivery Hero, and the market feared for capital discipline. The quarterly earnings guide is $0.84–0.88 against a $0.89 consensus.
FactBookings +22% in constant currency, trips +18%, 208 million active customers (+16%), EBITDA +33%. Headline revenue +12% is understated by eight points of UK accounting changes. FCF above $10bn a year at 15.6x. On 10 September CEO Khosrowshahi bought 141,000 shares at $70.96, the only insider purchase of that scale anywhere on the list. Consensus $101.
Thesis breakA close below $64.5 (under the 52-week low) or Q3 bookings below +17% constant currency with declining trips. Skeptics: robotaxis are a 2028 risk, but buybacks slowed to $518m a quarter against $17bn of deals, and +15% means retaking the August peak through the 50- and 200-day averages.
Touch probability over the horizon · 84 trading days
Catalyst: ≈4 Nov — Q3 report; November — Delivery Hero tender milestones
6SYKStryker · medtech: implants, the Mako robot$278 · -29% from the 52-week high · RSI 38
−29% from 52w high17x against a 25–30x history9% organic growth · guidance heldCEO change on 1 Jan 2027analysts + skeptics: 23% for +15%
FearNews, not technology. A March cyberattack halted production and costs 70–80 basis points of growth for three straight quarters; the shortage at the Inari plant in the vascular segment slipped from the third quarter to the fourth. On 9 September at a conference the CFO added that hip-implant demand in Europe is softer and some patients are postponing surgery.
FactQ2: sales $6.6bn (+9% organic), EPS +18%, operating margin 27.4% (+170bp). US knees +6%, record Mako robot sales, a record capital-equipment backlog. Full-year guidance (8.3–9.3% organic) reaffirmed on 8 September. 17x against a 25–30x history.
Thesis breakA close below $260, or a cut to the full-year guide on 29 October with supply recovery pushed into 2027. Skeptics: the shortage has already slipped a quarter once, hip weakness is partly demand-driven, and consensus earnings sit at the bottom of the guide with no cushion.
Touch probability over the horizon · 84 trading days
Catalyst: 29 Oct — Q3 report; supply-recovery date
7BKNGBooking Holdings · online travel$158 · -30% from the 52-week high · RSI 22
−30% from 52w highRSI 22, lowest in the top87% gross · 34% FCF14x P/Eanalysts + skeptics: 32% for +15%
FearAI agents will take the customer away from the intermediary. On 22 September Meta Muse learned to book flights without the Booking site, and Expedia became a launch partner while Booking did not. On 9 September the EU court upheld the block on the eTraveli acquisition. September was the stock's worst month since June 2022.
FactQ2: revenue +8%, EPS +15%, room nights +5% against a 2–4% guide. Gross margin 87%, FCF margin 34%. In the first half the company bought back $7.4bn of stock at an average of about $173, 9% above today's price. There is no data point on leakage to agents in the reports. 82% of analysts rate it Buy, consensus $238.
Thesis breakQ3 room nights below +3%, or a cut to the full-year guide on 3 November. Technically, a close below $140, breaking the 52-week low. Skeptics: the guide already slows to +4–6%, and three months cannot prove the absence of disintermediation.
Touch probability over the horizon · 84 trading days
8DECKDeckers · HOKA and UGG$81.66 · -33% from the 52-week high · RSI 48
−33% from 52w high10.7x P/E · $1.1bn net cash5.7% of shares bought back a yeargrowth slowing to 6%analysts + skeptics: 33% for +15%
FearHOKA brand fatigue, tariffs, a weak American consumer. In May the full-year earnings guide gave only +4–6% with margin compressing from 23% to 21.5% and about $120m of tariff costs. On 8 September BMO opened an Underperform with a $70 target. On 2 October Nike guided revenue down high single digits, and the sector flinched.
FactThe first quarter above $1bn of revenue (+5.7%), HOKA +8%, direct sales +13%, gross margin 56.4%. Earnings guidance raised to $7.35–7.50. Net cash $1.1bn, return on invested capital about 91%. $338m of stock bought back in the quarter at an average of $104, 21% above today's price, with $4.7bn of authorisation left, 42% of the market cap.
Thesis breakA close below $75.5 (under the 52-week low), or the 22 October report with a US decline or an earnings-guide cut below $7.35. Skeptics: quarterly operating profit fell 6% on rising revenue, the US is flat, and the cheap multiple reflects lost momentum rather than a market error.
Touch probability over the horizon · 84 trading days
Catalyst: 22 Oct — Q2 FY27 report (EPS guide $1.73–1.78)
9GSGoldman Sachs · investment bank$897 · -22% from the 52-week high · RSI 28
−22% from 52w highRSI 2813x P/E · ROE 23.5%break risk 15, the lowestanalysts + skeptics: 28% for +15%
FearNo company news. On 14 September the head of BofA projected investment-banking fees down 10% for the quarter, and every bank fell. On 16 September came the rate hike, GS down 4% in a day. On 22 September, Muse and the fear for brokerage fees. September became the financial sector's worst month against the S&P 500 since 1990.
FactQ2 was a record: revenue $20.3bn (+39%), EPS $20.98 (+92%), return on equity 23.5%. $4bn bought back in the quarter, dividend raised 25%. The full-year earnings forecast rose from about $60 to about $68 per share since late June while the multiple compressed from 17x to 13x. Consumer business is about 1% of revenue: Muse has nothing to do with it.
Thesis breakA weekly close below $820, or the 13 October report with return on equity below 14%. Skeptics: Q2 was a cycle peak, the 2027 forecast gives +2% revenue and +7% earnings, so 13x on peak earnings is not a discount; 16 of 25 analysts sit at Hold.
Touch probability over the horizon · 84 trading days
Catalyst: 13 Oct — Q3 report (consensus EPS about $15.4)
10IDXXIDEXX Laboratories · veterinary diagnostics$515 · -33% from the 52-week high · RSI 42
−33% from 52w highguidance raised twice this year35% operating marginlow volatility, modest oddsanalysts + skeptics: 27% for +15%
FearAmericans take their pets to the vet less often. In February management built a 2% decline in US visits into the forecast, and the stock lost 6% in a day on an earnings beat. Since then the multiple has compressed for ten straight months despite two guidance raises. The $770 peak was in November 2025.
FactQ2: revenue $1.22bn (+9% organic), earnings +18%, operating margin 35%. Recurring diagnostics revenue +10%, driven by volume rather than price. Earnings guidance raised to $14.69–14.94. $332m bought back in the quarter at an average of $571, above today's price. The lowest structural-break risk among all 28 names dissected.
Thesis breakA weekly close below $480, or the 2 November report with recurring diagnostics organic growth below 8%. Skeptics: a 31–33x multiple after a one-third drop is not cheap, and low volatility means +15% in 84 days is rare: the model gives 27%.
Touch probability over the horizon · 84 trading days
The same thesis as Goldman and the same shock: a record quarter, RSI 29, 15x. Left off the top only because it correlates with GS; owning both at full size makes no sense. Reports on 14 October, the same morning as CPI.
SE-50% from 52w highSea Limited
Revenue +48% and RSI 23, but EBITDA grows only 11%: marketing +64%, credit provisions +71%. Operating margin 8%. Insiders sold hundreds of millions of dollars of stock in three months with no purchases. Growth bought with margin is not our health profile.
DASH-32% from 52w highDoorDash
The highest overreaction signal in the engine and the only name whose targets analysts are raising on the way down. But a 4.5% operating margin fails the health filter: the company is deliberately reinvesting. It returns once the 2027 margin is confirmed on 4 November.
ADBE-34% from 52w highAdobe
The AI-fear archetype at 9x earnings with an 89% gross and 41% FCF margin. But recurring-revenue growth has slowed to 10%, margin lost 150bp, and the CEO, CFO and creative chief are changing at once. Three skeptics agree: a value trap until acceleration is proven. Two dates: Adobe MAX on 10–12 November and the December guide.
NFLX-45% from 52w highNetflix
Down 45% from the peak, 20x, a $27bn buyback: tempting. But viewing hours grew only 2% in half a year, the Nielsen share is slipping, and ad revenue missed the plan by 7%. That is a real slowdown, not only fear. The test is 20 October.
SPGI-24% from 52w highS&P Global
The highest-quality business in the screen: 71% gross, 35% FCF, 21x, a five-year low, and the CEO bought stock in the spring. But the drawdown from the 3-month peak is only 12%, and the engine sees no overreaction. Accumulate slowly rather than wait for a bounce.
APP-62% from 52w highAppLovin
A 66% FCF margin and 15x on +53% revenue, down 62% from the peak. But five straight quarters of deceleration, class actions over AI claims, an open SEC investigation and $160m of insider sales in June. The speculative bucket, not healthy economics without breaks.
ORCL-55% from 52w highOracle
Down 55% from the peak on +30% revenue and a $664bn backlog. But free cash flow for the year is minus $29bn, debt is $169bn, the rating is BBB−, one notch above junk, and 2027 earnings grow only 7% because interest and depreciation eat the growth. A bet on financing, not on health.
INTU-58% from 52w highIntuit
Down 58% from the peak, 12.6x, a 40% FCF margin, a Muse launch partner. But TurboTax is losing users (−2% for the year) and is guided to +2–3%; JPMorgan and BofA downgraded on the risk that AI agents reach QuickBooks. A break risk of 55 is too loud for this column. Reports 19 November.
MDB-24% from 52w highMongoDB
Guidance raised, Atlas +29%, but on 28 September the CEO left for Meta after a year in the job, the second change of chief in 11 months. 52x earnings with a GAAP margin near zero. Wait for a permanent CEO.
CRM-16% from 52w highSalesforce
15x on a 77% gross margin and a $25bn buyback. But organic growth is 7–8%, the balance sheet is levered for the buyback, and on 6 October the software sector set new highs for the year while Salesforce fell 2%: the weakness has become idiosyncratic. The catalyst comes only in early December.
SPOT-31% from 52w highSpotify
Operating profit +61%, €9.4bn of cash, but 32x and only a 13% drawdown from the 3-month peak. AI and marketing spending +18%, Apple Music has overtaken it in US subscribers. Two of the last three reports went down. The test is 22 October.
06How it is computed
The snapshot is computed by code, not people. Every Monday a script on the PanicRadar server takes 1.2 million quotes from its own database and, for each of the 156 stocks, computes the drawdown from the 52-week high (Finnhub data) and from the 3-month high, RSI14, the one-month lag against SPY, the distance to the 50-day average and 60-day realized volatility. Alongside sits the PanicRadar engine's own overreaction index; we do not publish its formula.
Business health, 0–100. Revenue growth for the year and the quarter, gross and operating margin, return on equity, debt to equity, earnings growth. For banks debt is ignored; theirs is structural. Vetoes: falling revenue, losses, operating margin below 5%, debt above 3x equity without interest cover, negative cash flow, an earnings collapse.
Pool and dissection. A stock enters the pool if it is down 18% or more from the 52-week peak, or 12% from the 3-month peak, or has RSI below 40, or trails SPY by 8 points over a month. Of 104 in the pool, 47 are healthy with no vetoes. 28 of them went through agent dissection: one bull analyst assembles the thesis with dates and sources, three skeptics try to break it, through business structure, through estimate revisions, and through timing and flows. The skeptics' instruction is to refute by default.
Probabilities. The cards show the chance that the price touches +15, +20, +30% and −15% at least once over the chosen horizon: the classic formula for a driftless random walk on 60-day realized volatility. The horizon slider recomputes it honestly: longer and more volatile means both numbers rise, up and down. Separately, in a badge, the analysts' estimate: 40% from the bull dissection and 60% from the average of three skeptics. Where the skeptics give less than 25%, we show it rather than hide it. The order of the top follows the chance of touching +15% within 84 trading days, ties broken by consensus upside. It is an order of juiciness, not safety: IDXX and GS carry the lowest thesis-break risk and sit at the end.
07When the method breaks
Yields above 5.5%. Then multiple compression continues even through strong reports, and the whole basket becomes a bet on a rates reversal. Half of this risk is common to all ten.
Cheap on peak earnings. Goldman after a record quarter, Western Digital on 54% margins in a three-player oligopoly: here a low P/E can be a cycle top rather than a discount.
Binary reports. Nine of ten report by 5 November. Vertiv's last report cost 17% on a beat, Western Digital's 13%. Entering in parts before and after the date is not advice; it is a consequence of this statistic.
Low volatility. IDEXX and Goldman move slowly: the model gives them 27–33% for +15% in 84 days. These are names for patience, not for a week.
The universe is 156 names. It is the engine's watchlist, not the whole market. Better candidates may exist outside it, and by definition they are not here.
Why are only three names in the top driven by AI fear if that is the main thesis?
Because the health filter is strict. Most victims of the AI narrative are software names growing 7–10% with downward estimate revisions (Adobe, Salesforce, Intuit), where fear and numbers walk together. Booking, Expedia and Uber passed because their reports show no data point of customers leaking to agents.
Why Goldman and not Morgan Stanley?
Same thesis, same shock. Goldman fell further (−22% against −18%), has a lower P/E and reports a day earlier. Morgan Stanley is first on the bench and takes over if on 13 October the banks confirm the drop was only multiple compression.
What does health 67 in the Booking card mean?
It is a 0–100 composite of revenue growth, margins, return on equity, debt and earnings growth from Finnhub's trailing-12-month data. 67 is a healthy business with moderate growth; Broadcom's 97 is growth above 80% at a 48% margin. The threshold for the top is 50 and no vetoes.
Why are the probabilities so modest, 27–71% for +15%?
Because they are honest. The driftless barrier-touch formula gives exactly what volatility implies: Vertiv, with 65% annual volatility, touches +15% with a 71% chance, but also −15% with a 67% chance. The analysts with skeptics give 23–39%. For a basket of ten, the base case is three or four names making +15% in a quarter, one or two making +30%.
How often is the column updated?
The snapshot runs every Monday, automatically, and feeds a table in the author's private cockpit. A full issue with dissection and skeptics comes when the snapshot shows new healthy names in the pool or ahead of earnings season, roughly monthly. The next one follows the late-October reports.
How to read this. A card is a thesis, a fact and a break condition. If the condition fires, the thesis is dead regardless of the entry price. The horizon slider and the fear filter show how much of your basket is a bet on rates and how much on companies. The table of all 156 tickers lives in the author's private cockpit and is not published here. · Читати цей випуск українською →