Industrial 3D Printing: The Market Grew 18-Fold While Printer Makers Lost Up to 97% of Their Value
A fact-based analysis: how additive manufacturing grew from $1.3bn to $24.2bn in 15 years, why forecasts erred in both directions, why the technology won while Western printer makers and SPAC-listed companies lost, how metal, defense and electronics launched a new cycle, and why China leads in units but not in money. 16 charts, cases of Apple, GE, Deutsche Bahn, Rocket Lab.
On this page
- 01 · Fifteen years: from $1.3bn to $24.2bn, and still 0.13% of industry
- 02 · Forecasts were wrong in both directions
- 03 · Where the money is made: parts, not machines
- 04 · The technology won, the sellers lost
- 05 · A new cycle: metal, defense, electronics
- 06 · China: leader in units, not in money
- 07 · Six pieces of evidence for industrial scale
- 08 · The economics of a part: when printing is really cheaper
- 09 · Defense, rockets, drones
- 10 · Patents, science and standards
- 11 · What next: scenarios to 2033
- Sources
In November 2025 Apple announced that all titanium cases of the Apple Watch Ultra 3 and Series 11 are now 3D-printed. Six lasers simultaneously fuse recycled titanium powder in layers of 60 microns; one case takes more than 900 layers and about 20 hours. It uses half as much raw material as the previous method; by the company’s estimate, more than 400 metric tons of titanium were saved in 2025 alone. That same year Desktop Metal, which in February 2021 was valued on the stock market at more than $7.5bn, filed for bankruptcy 16 weeks after it was bought for $179m. These two pieces of news are about one and the same technology.
Industrial 3D printing won as a technology and lost as a business for those who sold printers: the money went to those who print finished parts, and to Chinese machine makers. Below are 15 years of data: the size of the market, forecasts that did not come true, company finances, the new cycle of metal printing, the role of China and defense, and the economics of a single part.
01 · Fifteen years: from $1.3bn to $24.2bn, and still 0.13% of industry
Wohlers Associates, the industry’s oldest analyst firm, counts the additive-manufacturing market as the sum of sales of equipment, materials, software and printing services. By this count it was worth about $1.3bn in 2010, $5.2bn in 2015, $12.8bn in 2020 and $24.2bn in 2025. That is an 18-fold increase, an average of roughly 21% a year. Few industrial technologies can show such a series over a decade and a half.
But the pace has changed. In 2011–2015 the market added 25–35% a year; in 2024–2025, 9–11%. The pandemic year of 2020 gave only 7.5%, then came a rebound of 19.5% and 18.3%, after which the industry settled into the pace of a mature engineering niche.
The scale is worth keeping in mind. World manufacturing generates about $16.6trn of value added a year (World Bank, 2024). Even if one crudely sets the revenue of 3D printing beside this sum, it comes to roughly 0.13%, one part in 760. 3D printing has not replaced factories. It has found its niche in them and is growing in it faster than the rest.

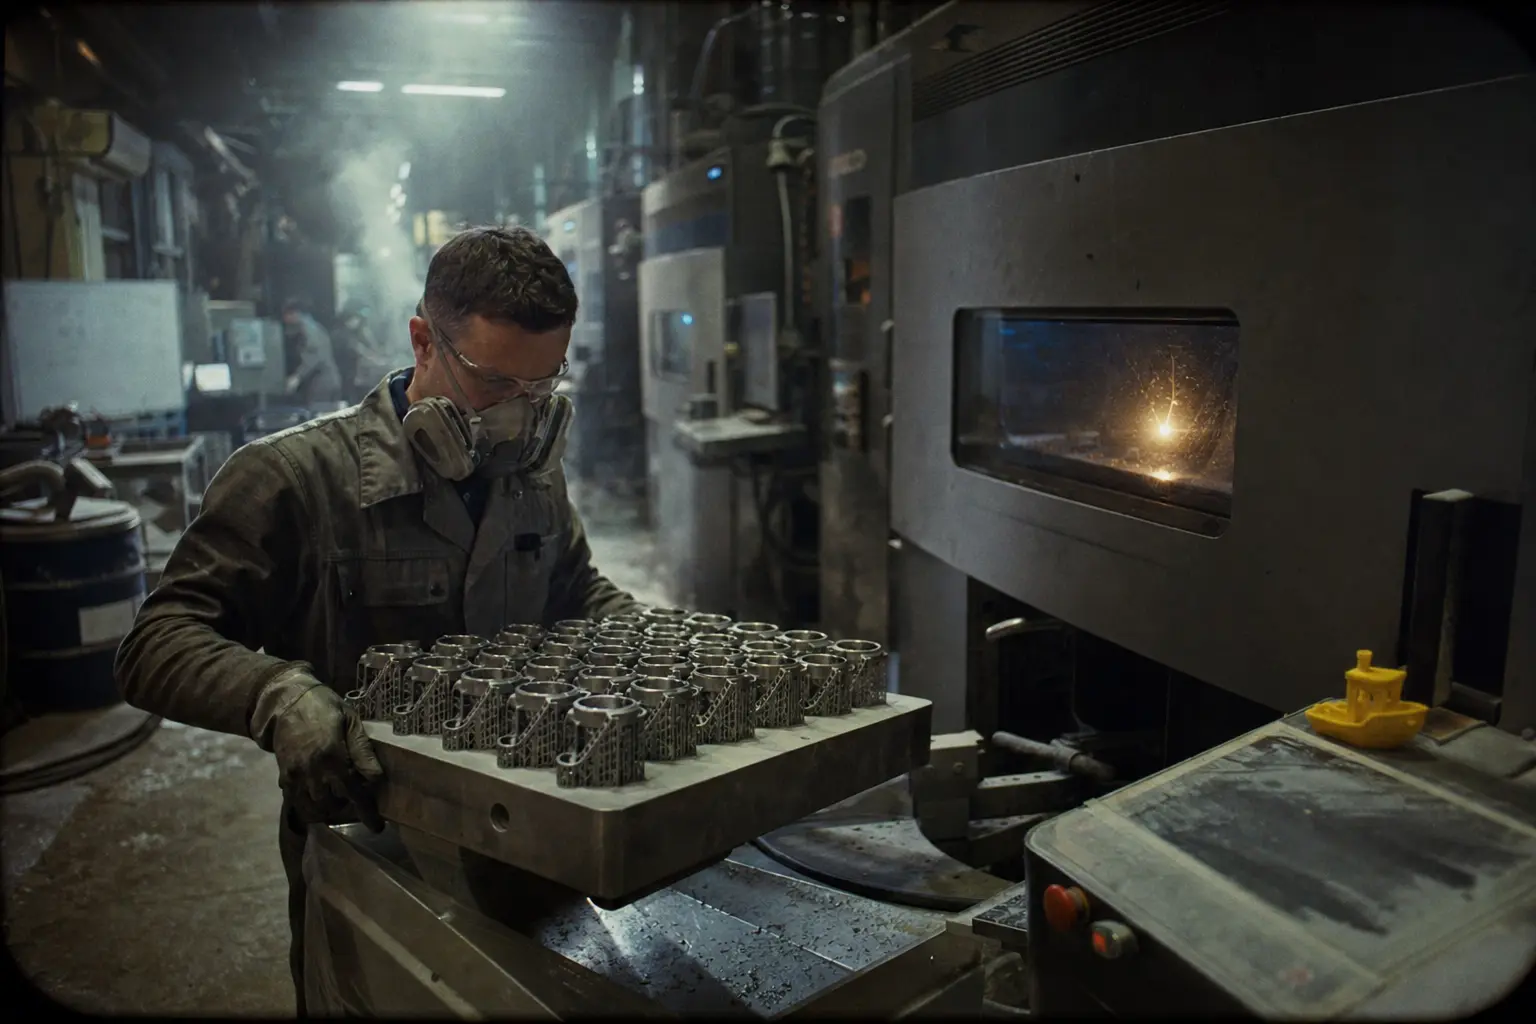
In 2013 a desktop printer was promised to every kitchen. The warehouse shows how a forecast ends when it counts wishes, not parts.
02 · Forecasts were wrong in both directions
The history of 3D printing is also a history of forecasts. In February 2013 President Barack Obama told Congress that 3D printing had the potential to “revolutionize the way we make almost everything”. A year earlier Chris Anderson, the former editor-in-chief of Wired, published the book “Makers”, about a new industrial revolution of desktop factories. In 2013 Stratasys bought MakerBot, a maker of home printers, for about $400m in its own shares.
Analysts’ figures at the time diverged from reality by tens of percent, and not in one direction.
In 2012 Wohlers forecast that by 2019 the market would reach $6.5bn. In fact it was almost twice as large, at about $11.9bn. In 2014, at the height of the euphoria, the same firm promised $12.8bn in 2018 and more than $21bn in 2020. The actual figures were about $9.8bn and $12.8bn, that is, 39% below the forecast for 2020. The market reached $21bn only in 2024, four years later.
Gartner in October 2014 predicted that the market for printers alone would reach $13.4bn in 2018, with sales of 2.3m units a year. That is more than the entire additive-manufacturing market that year, materials and services included. EY in 2019 forecast $27.4bn for 2023; the outcome was $20.0bn, 27% less. The best-known figure, $230–550bn “by 2025” from McKinsey (2013), is not about the market at all: it is an estimate of the economic effect of printed goods, which was later retold as a revenue forecast.
The conclusion is not that 3D printing was a bubble. Short forecasts of one or two years worked well: the 2021 Wohlers forecast named $17.7bn for 2022, and the outcome was $18.0bn. Long forecasts were wrong. More wrong still was the idea of where the market would be. It was expected in kitchens; it grew in factories.
03 · Where the money is made: parts, not machines
According to the Wohlers Report 2026, 48% of the industry’s revenue in 2025 came from printing services: companies that print, finish and sell ready parts to order. Machine sales, including service, gave 26%, materials 20%, software 6%. Services grew by 15.5% over the year, system sales by only 3.6%. By the same methodology, in 2013 parts for end products accounted for about 35% of the market.
This is the main shift of the decade. The machine is only an entry ticket. The money is made by whoever can reliably get a certified part out of it: selects the parameters, removes the powder, heat-treats, finish-machines, inspects and takes responsibility for the result.
Yet most users still print prototypes. In a 2024 Protolabs survey (more than 700 engineers and buyers), 67% of respondents named prototyping as their main use, and 21% end-use parts. The share of end-use parts is growing slowly: 20% in 2022, 21% in 2023. Among the reasons for choosing printing, speed comes first; it is named more often than cost or geometry.
04 · The technology won, the sellers lost
Stratasys and 3D Systems founded this industry in the 1980s and for more than 30 years were its face. In 2025 Stratasys had revenue of $551m, less than in 2015 ($696m) and in 2016. 3D Systems had $387m against $666m ten years ago, a fall of 42%, partly because of the sale of divisions. Over 2015–2025 each posted cumulative losses: Stratasys about $2.4bn, 3D Systems about $1.4bn. A large part of these sums is goodwill write-downs, that is, an admission that companies bought during the boom are not worth what was paid. Stratasys alone wrote off $942m in 2015.
Over the same period the market in which they operate grew fourfold. The exception among Western public companies is Belgium’s Materialise: revenue rose from €102m to €268m, mainly thanks to software and medical devices, that is, not the sale of printers.
The stock market responded accordingly. Stratasys shares cost $136 in the first quarter of 2014; as of October 23, 2026, $6.87. 3D Systems: $97 and $3.07. The market capitalization of both together is about $1.1bn, less than that of either of the two Chinese competitors taken separately, discussed below.
The second wave ended even worse. In 2020–2021 six 3D-printing start-ups went public via SPACs, a merger with an empty listed company that lets a firm bypass a traditional IPO. According to press reports, their combined valuation at the time of listing exceeded $8bn.
| Company | Listing | Valuation (at listing or peak) | What happened |
|---|---|---|---|
| Desktop Metal | December 2020 | over $7.5bn | Bought by Nano Dimension for $179m (April 2025); 16 weeks later, bankruptcy under Chapter 11; main US assets sold for about $7m |
| Markforged | July 2021 | ≈$2.1bn | Bought by Nano Dimension for $116m (2025), resold to Stratasys for $42.5m (deal of May 2026) |
| Velo3D | September 2021 | ≈$1.65bn | Delisted from the NYSE (2024); a creditor received ≈95% of the shares; returned to Nasdaq; value ≈$0.2bn |
| Fathom | December 2021 | ≈$1.5bn | Goodwill write-down of $1.19bn; bought out by a private fund at $4.75 a share (2024) |
| Shapeways | September 2021 | ≈$0.4–0.6bn | Revenue stuck at $32–35m throughout; liquidation under Chapter 7 (July 2024) |
| Fast Radius | February 2022 | ≈$1bn (planned) | Bankruptcy under Chapter 11 (November 2022); assets sold for ≈$16m |
Not all buyers were burned equally. Japan’s Nikon bought Germany’s SLM Solutions, one of the leaders in metal printing, for €622m, or €20 a share, 47% less than GE had offered in 2016. Israel’s Nano Dimension paid about $295m over two years for Desktop Metal and Markforged, will get back $42.5m, and reported a loss from discontinued operations of $193m in 2025.
The explanation is not that the technology failed. Parts were printed; customers bought. The problem is the economics of the equipment maker: expensive machines sell cyclically, competition quickly pushes prices down, and the most profitable part, repeat orders for parts and materials, goes to those closer to the end customer. The biggest patent holders in additive manufacturing are General Electric, Raytheon, HP and Siemens, not specialized 3D-printing companies.
05 · A new cycle: metal, defense, electronics
After the boom of 2021, industrial printers (those costing more than $100,000) sold steadily worse for two years. Shipments in the third quarter of 2024 fell by 24% year on year, and 2025 as a whole ended down 3%, the fourth annual decline in a row. Then the cycle turned: +3% in the third quarter of 2025, +12% in the fourth, +18% in the first quarter of 2026, +25% in the second. Revenue from industrial machines in the second quarter of 2026 grew by 40%. CONTEXT, an analytics firm, attributes the turn to demand from defense companies, drone makers, the aerospace industry and consumer electronics.
The equipment market has split into two extremes. Cheap machines costing up to $2,500, mostly Chinese, grew revenue by 36% in the second quarter of 2026. The most expensive industrial ones grew by 40%. Between them the professional class ($2.5–20,000) is being squeezed: revenue fell by 24%, because cheap printers have become good enough for engineering prototypes.
The main thing in the industrial class is metal. In the second quarter of 2026 metal machines accounted for 53% of industrial shipments by units and 75% by revenue; metal shipments rose by 36% and revenue by 51%. Of that revenue, 83% comes from laser powder-bed fusion: a laser melts metal powder layer by layer, and a finished part emerges from the bed, with internal channels and lattices that cannot be made by casting or milling.
Sales of metal systems rose from 198 in 2012 to 3,793 in 2023. The machines themselves have changed too. Ten years ago a typical metal printer had one laser and a chamber the size of a microwave oven. In 2020 SLM Solutions showed the NXG XII 600, with twelve one-kilowatt lasers and a claimed productivity of more than 1,000 cubic centimeters per hour. In 2024 China’s Eplus3D unveiled the EP-M2050: 36 lasers in the base version and up to 64 in the extended one, a chamber of 2.05 × 2.05 × 1.1 meters, and a machine weighing 145 metric tons. At a trade show in March 2026 the same company announced a platform with 100–256 lasers. The race for the number of lasers is a race for unit cost: the more lasers work at once, the less an hour of printing costs per cubic centimeter.
06 · China: leader in units, not in money
In the year to the end of the second quarter of 2026, China took 37% of global shipments of industrial printers, North America 29% and Western Europe 21%. In the segment of cheap machines the lead is larger still: Chinese brands sell about 95% of all printers under $2,500 in the world, and in the first half of 2026 China exported 3.9m printers. Bambu Lab, founded in 2020 in Shenzhen by former DJI engineers, sold about 1.2m printers in 2024, according to consultants’ estimates. Chinese media put its 2024 revenue at 5.5–6bn yuan (about $0.8bn), more than that of Stratasys, which has been building this market for 35 years. The company does not disclose its finances.
Among industrial makers of metal machines the picture is similar. Bright Laser Technologies (BLT) of Xi’an raised its revenue from 322m yuan in 2019 to 1.85bn in 2025 (about $277m) and earned 204m yuan in net profit. Farsoon of Changsha went from 155m to 716m yuan. The market value of BLT and Farsoon together is about $7.2bn, 4.5 times that of Stratasys, 3D Systems and Materialise combined. China’s leaders by number of metal machines sold are BLT, Eplus3D, ZRapid and Farsoon.
But the money is still elsewhere. By revenue from metal printers worldwide, Germany’s EOS and Nikon SLM lead: Chinese machines are cheaper, so there are more of them in units and fewer in dollars. Valuations on the Shanghai exchange also recall Stratasys in 2014: Farsoon is valued at about 35 times annual revenue, and Eplus3D withdrew its IPO application in March 2026 without explanation.
In science China is already ahead: in 2022 Chinese authors for the first time published more papers on additive manufacturing than American ones, and in 2025 the count was 3,478 against 1,963. In international patents the situation is the reverse: according to the European Patent Office, from 2001 to 2020 the United States accounts for 40% of international patent families, Europe for 33%, Japan for 14% and China for 3.7%. Chinese applicants mostly patent at home. According to an official estimate by China’s Ministry of Industry and Information Technology, the domestic additive-manufacturing industry was due to reach 70bn yuan in 2025, 30% more than a year earlier.
The West is responding with restrictions. Since April 2024 Britain has required a license to export metal printers of a certain class; according to the trade press, the United States introduced similar controls the same year. According to trade-press reports, the American defense budget act for 2026 bans the Pentagon from buying 3D-printing machines made in China, Russia, Iran or North Korea.
07 · Six pieces of evidence for industrial scale
There have always been plenty of prototypes at trade shows. Below are cases with quantitative data on serial production. Most of the figures are the companies’ own claims; there is no independent audit.
| Company | What is printed | Scale and effect |
|---|---|---|
| Apple | Titanium cases for the Apple Watch Ultra 3 and Series 11; the USB-C port housing in the iPhone Air | 100% of cases printed from recycled powder; half the raw material; more than 400 metric tons of titanium saved in 2025 |
| GE Aerospace | Fuel nozzle for the LEAP engine | One part instead of 20, 25% lighter; 30,000 units by 2018, the 100,000th in 2021; 18–19 nozzles in each engine |
| Deutsche Bahn | Train spare parts on demand | More than 200,000 parts in service, more than €20m saved since 2015; the largest is a 540 kg gearbox housing; goal: 10% of spare parts in digital form by 2030 |
| Align Technology | Custom molds for clear aligners | According to the company, more than 1m custom items a day; the molds are printed, not the aligners themselves; direct printing is only beginning |
| Rocket Lab | Rutherford rocket engine | All main components printed; the 1,000th engine in May 2026; about 200 engines a year versus about 12 in 2017 |
| Siemens Energy | Burner for the SGT-700 gas turbine | One part instead of 13 parts and 18 welds |
What unites these examples is not an industry but a type of part. A watch case, a nozzle, a burner and a combustion chamber have complex internal geometry that cannot be made, or is very costly to make, by casting and milling. An aligner mold is unique to each patient, so a production mold for it makes no sense. A spare part for a locomotive of the 1990s is needed as a single piece ten years after the supplier has shut down. Each of these cases is a part for which the old methods are structurally uneconomic.
Consumer electronics is the freshest example. In March 2025 Oppo put into its foldable smartphone, the Find N5, a printed titanium hinge element made on BLT machines: thickness fell from 0.3 to 0.15 mm, and stiffness rose by 36%. For the Honor Magic V2 a hinge cover was printed; by Eplus3D’s estimate, the printing itself cost about $4, and the grinding and polishing about $40. That proportion is the shortest explanation of the industry’s economics.
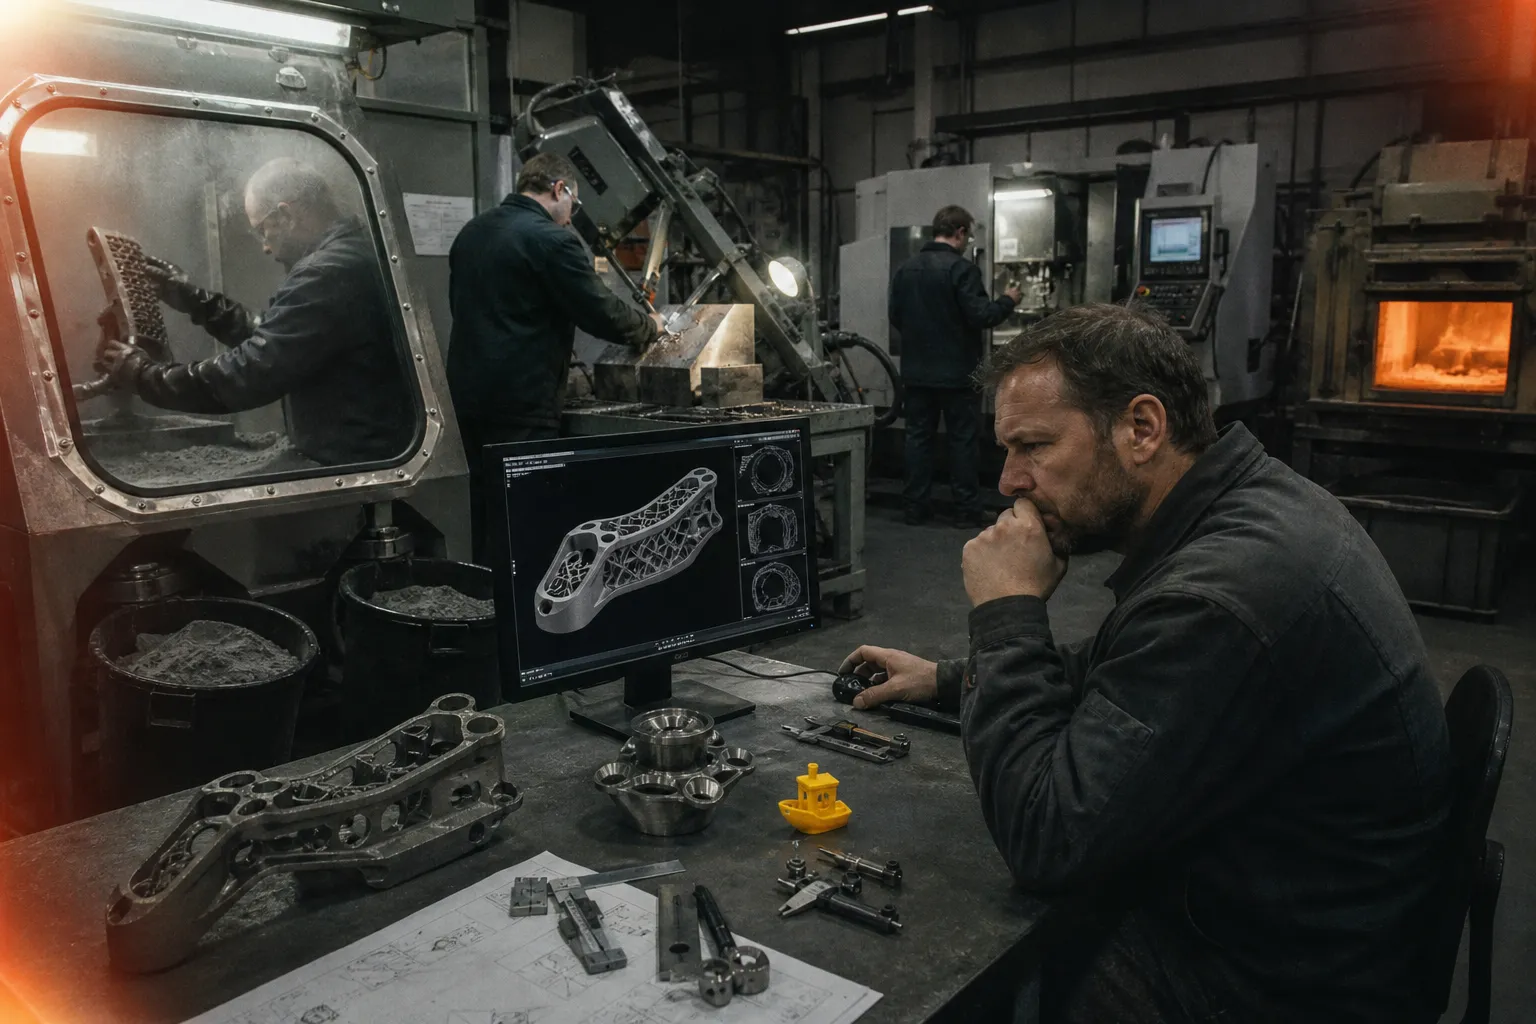
Printing takes a night. Clearing the powder, sawing the parts off, heat-treating, finish-machining and inspecting take a week. That is where the production cost lies.
08 · The economics of a part: when printing is really cheaper
The simplest argument for metal printing is the material. In aviation, titanium parts are often milled from a solid billet: for every kilogram of part that will fly, 10 to 40 kilograms of metal are bought, and the rest goes into chips. Printing needs 1 to 3 kg of material per kilogram of part. Powder is costlier than billet (equipment suppliers put the price of printing-grade titanium alloy at $300–600 a kilogram), but when the saving in raw material is two- or tenfold, the price difference per kilogram stops being decisive. That is how Apple got a 50% cut in raw material.
The second argument is tooling. Injection molding requires a mold that costs tens of thousands of dollars, but after that the part costs pennies. Printing needs no mold, but every part costs almost the same regardless of the run.
In 2026 researchers at Sungkyunkwan University in South Korea compared the two methods on a single simple polymer part, a 30 mm cube. The mold cost $80,000. At a run of 1,000 units the molded part cost $80.17; at 100,000, $0.97. The printed part cost $7.96 (polymer powder) or $10.67 (photopolymer), regardless of the run. The point at which molding becomes cheaper is about 10,000 identical parts. If, however, 50 different parts of 200 units each are needed, molding would require 50 molds, about $4m for tooling alone.
For metal the break-even point is lower, but the cost structure is different. A laser powder-fusion machine costs $300–800,000 with one laser and up to several million with many; an hour of its operation costs from $10 to $100, depending on the number of lasers. According to a 2019 Wohlers survey, printing itself accounts for 59% of the cost of a metal part, and preparation and post-print processing for almost 40%. By other estimates, post-processing alone accounts for 30% to 60%. Here is also the reason why several companies have won while the machine makers have lost: the most cost, and the most irreplaceable experience, lies not in the printer but around it.

The fastest “drawing-to-part” cycle in the world today is not at an aerospace plant but in a basement where mounts for drones are printed.
09 · Defense, rockets, drones
Defense has become the most conspicuous new customer. In June 2026 Beehive Industries, an American maker of small jet engines for strike drones, ordered 30 M4 ONYX metal printers from EOS for $50m. CONTEXT reported that in the same quarter EOS signed the largest contract in its history, with a maker of defense drones. Firestorm Labs won a five-year contract worth up to $100m from the US Air Force for mobile factories that print drones. Divergent Technologies, which prints and assembles metal structures for Lockheed Martin, Raytheon and General Atomics, raised $290m at a valuation of $2.3bn in September 2025.
The US Navy is printing parts for submarines because traditional suppliers cannot keep up: more than 100 critical parts were, on average, more than 300 days late. The first printed metal part, a ventilation diffuser, was installed on a submarine in May 2023. In 2025 about 120 parts were in development, “dozens” had already been installed, and cumulative delays had shrunk by 1,400 days. Some $450m has been set aside for large-format arc deposition of metal.
Defense budget figures should be read with care. An analysis of the Pentagon’s budget for fiscal 2026 showed projects “related to additive manufacturing” growing from $1.8bn to $3.3bn. But projects wholly devoted to 3D printing shrank from $61.9m to $58.4m. Much of the “boom” is new labels on budget lines, not new money for printing.
Rockets tell a revealing story. In March 2023 Relativity Space launched its Terran 1 rocket, about 85% of whose mass was printed. It did not reach orbit, and for its next rocket, according to trade publications, the company went back to welded aluminum. The engines stayed printed. In May 2026 Rocket Lab rolled out its 1,000th Rutherford engine, all of whose main components are printed; it makes about 200 a year. In its RAMPT program NASA has run more than 16,000 seconds of hot-fire tests on printed chambers and nozzles; making a nozzle has gone from years to months. The conclusion is the same as in civilian industry: not everything is printed, but the most complex parts are.
Ukraine shows the other pole: cheap desktop printing on the scale of a war. In 2025 the Ukrainian army received about 3m FPV drones (by other official estimates, up to 4m); 7m are planned for 2026. Stabilizers, mounts, housings, and holders for batteries and antennas are often printed on thousands of desktop printers. As long ago as 2023 The Economist described volunteer workshops printing up to 1,000 munition casings a week, at €3.50 apiece on a $1,200 printer. In 2025 Ukraine’s Ministry of Defense launched a catalog of 170 Ukrainian-made components. This is not industrial metal printing, but the economics are the same: there is no mold, a design can be changed overnight, and production can be located anywhere.
10 · Patents, science and standards
The number of international patent families in additive manufacturing rose from 1,117 in 2010 to 8,090 in 2020. In 2013–2020 it grew by 26.3% a year, eight times faster than patenting in general (3.3%). The share of 3D printing in all international patents climbed from 0.4% to 2.1%. The most patents belong to General Electric (1,793 families), Raytheon (1,441), HP (1,362) and Siemens (996): industrial giants for which printing is a tool, not the main product. Universities and public laboratories account for 12% of filings, almost twice the average across technologies.
In 2010 there were 117 scientific papers on additive manufacturing; in 2025 there were more than 13,000. The ISO technical committee on additive manufacturing has already published several dozen standards; in 2023 it issued ISO/ASTM 52920, the first standard for qualifying a production site. It is standardization, not new printers, that determines how quickly a part reaches an aircraft or an implant: qualifying a new process in aviation can still cost millions of dollars and take years.
11 · What next: scenarios to 2033
From a base of $24.2bn in 2025, the market could be worth $36bn in 2033 if it grows by 5% a year, $52bn at 10%, as in 2024–2025, $67bn at 13.5%, which AMPOWER forecasts for the industrial segment, and $104bn at 20%, as in the mid-2010s. Wohlers itself allows for up to $115bn in 2034. Grand View Research gives $168.9bn in 2033, but it counts from a different base ($30.5bn in 2025) and with broader coverage; the two series cannot be combined.
A more useful question is where demand will grow. The assessment below is our conclusion from the data in this article, not market statistics.
| Niche | Potential | Why | Main obstacle |
|---|---|---|---|
| Aerospace, rockets, defense | High | Complex lightweight parts, short development cycle, supplier disruptions | Process qualification, repeatability |
| Medicine and dentistry | High | Every item is unique, so a mold makes no sense | Regulation, traceability |
| Digital spare-parts warehouses | High | Expensive equipment sits idle because of a cheap part | Rights to drawings, certified files |
| Consumer electronics | Medium → high | Titanium, thin walls, savings on raw material | Unit cost in million-unit runs, finishing |
| Mass-produced metal goods (binder jetting) | Uncertain | High potential throughput | Shrinkage in sintering, material properties |
| Simple parts in long runs | Low | Customization of individual items | Casting and stamping are cheaper from a few thousand units |
Three things will decide which of the scenario lines comes true. The first is automation of post-print processing, because it eats between a third and a half of the cost. The second is standards and qualification, without which a part will not get into a production aircraft, turbine or implant. The third is the price of a machine hour, which Chinese manufacturers, with their dozens of lasers, are now cutting aggressively. The last line is good for buyers of parts and dangerous for those who sell printers.
We have already written about how war became open source, with a printer in every workshop and how a million drones became a test of a state’s ability to learn. The Chinese side of the story is in the piece on why founders pay to tour Chinese factories.
Ten years after the peak of euphoria, 3D printing has turned out to be what few wanted it to be: one more machine tool on the shop floor. Very fast, very precise and very economical for certain parts. The most expensive part of this industry is not the printer but everything that happens before and after the laser switches off.
Sources
- Wohlers Report: 2026 via 3DNatives, 2025, 2021, 2017, 2016, 2014 and forecast to 2020, 2012 and forecast to 2019, 2021 and forecast for 2022
- Gartner, 2014 forecast via THE Journal; EY Global 3D Printing Report 2019 via 3DNatives; McKinsey, 3-D printing takes shape; Obama’s 2013 address
- AMPOWER Report 2026 via Manufactur3D; Grand View Research, 3D printing market; World Bank, manufacturing value added
- CONTEXT: Q2 2026, Q1 2026, Q4 2025, Q3 2025, Q3 2024; regions: TCT
- Protolabs, 3D Printing Trend Report
- Company filings (SEC): Stratasys, Stratasys 20-F 2016, 3D Systems, 3D Systems Q2 2026, Materialise 20-F 2025, Nano Dimension 10-K 2025, Nano Dimension, sale of Markforged, Desktop Metal 10-K 2023, Velo3D 10-K 2025
- SPAC companies: Boston Globe on Desktop Metal, VoxelMatters on Fathom and the 2014 peak, Shapeways, Fast Radius; Nikon and SLM: 3D Printing Industry
- China: BLT and Farsoon: Eastmoney, Jiemian; Eplus3D: 3D Printing Industry, EP-M2050, EP-M3050; Bambu Lab: Yicai, TMTPost; MIIT: Science and Technology Daily; export controls: 3D Printing Industry; ranking of metal companies: VoxelMatters
- Machines: SLM NXG XII 600, Farsoon FS811M
- Cases: Apple, GE Aerospace, 100,000th nozzle, Deutsche Bahn via heise, Align, Align 10-K 2025, Rocket Lab, Siemens Energy, Oppo Find N5
- Economics: NLR, “buy-to-fly” ratio, printing versus casting, 2026, Wohlers 2019 cost structure, machine and powder cost
- Defense and space: Beehive and EOS, Firestorm Labs, Divergent, US Navy, 2023, US Navy, 2025, Pentagon budget, NASA RAMPT, Relativity, drones in Ukraine, The Economist on printing munitions via Mind.ua, United24 on printers at the front
- Patents, science, standards: EPO, 2023 study, EPO, press release, OpenAlex, ISO/TC 261, ISO/ASTM 52920
Frequently asked
How big is the 3D-printing market, really?
According to the Wohlers Report, $24.2bn in 2025, including equipment, materials, services and software; in 2010 it was about $1.3bn. By comparison, global manufacturing generates roughly $16.6trn of value added, so 3D printing is about 0.13% of it. Other analysts count differently: AMPOWER puts the industrial segment alone at €11.3bn, Grand View Research at $30.5bn.
If the technology is growing, why did printer makers’ shares collapse?
Because the money did not go to them. Almost half the market is printing services, which grew by 15.5% in 2025, while machine sales grew by only 3.6%. Stratasys had lower revenue in 2025 than in 2016; 3D Systems had 42% less than in 2015. The shares of both fell by 95–97% from their 2014 peak, and the companies that listed through SPACs in 2020–2021 have mostly gone bankrupt or been sold for next to nothing.
Will 3D printing replace factories?
No, and the numbers show it. Injection molding is cheaper from about 10,000 identical simple parts, and two-thirds of users still print mainly prototypes. 3D printing wins where a part is complex, the batch is small, customization is needed or a spare part would otherwise take weeks to arrive: Apple Watch cases, GE fuel nozzles, rocket engines, Deutsche Bahn spare parts.
Who leads: China or the West?
It depends on what you count. China buys 37% of industrial printers and makes about 95% of cheap desktop ones; since 2022 Chinese researchers have published more papers on additive manufacturing than Americans. But by revenue from industrial metal machines, Germany’s EOS and Nikon SLM lead, and in international patents up to 2020 China’s share is only 3.7% against 40% for the United States.
What is driving the market in 2025–2026?
Metal, defense and electronics. In the second quarter of 2026 shipments of industrial printers rose by 25% and revenue by 40%; metal machines accounted for 75% of industrial revenue. CONTEXT attributes this to demand from defense companies, drone makers and consumer electronics; EOS signed the largest contract in its history with a maker of military drones, and Beehive Industries ordered 30 metal printers worth $50m for engines for strike drones.
Comments
Signed-in readers only — to keep it human, not a bot swamp.