The Home Evening Economy: Are Streaming, AI Chats, Online Games and Delivery Killing Going Out?
A data-driven breakdown using BLS, Eurostat, Gallup, NTIA and stock-market filings: where the evening out has gone. In 2025 Americans spent more time on games and computers than on face-to-face socializing for the first time; Britain lost a third of its nightclubs while bars grew; the share of drinkers in the US is the lowest since 1939; DoorDash grew from 263 million to 3.2 billion orders. Socializing has not disappeared — it has moved into games, voice chats and streams.

On this page
- 01 · Five facts that do not depend on each other
- 02 · US: in-person socializing −26%, games almost ×2, 99 more minutes at home
- 03 · Europe: games ×1.5–4, in-person socializing down, “virtual” a new line
- 04 · Alcohol: fewer people drink, and they do not drink at the bar
- 05 · Nightlife: the late format is dying, not going out
- 06 · Home as the default: delivery ×12, working from home ×3.6
- 07 · Where socializing moved: Roblox, Discord, Steam
- 08 · Price: going out is getting more expensive faster than staying in, but not by enough to explain everything
- 09 · AI: the next layer — replacing the conversation partner, while it’s still 2–4%
- 10 · Causal model: what explains what
- 11 · Consequences: city, venue, person
- Sources
In 2025 the average American aged 15 or over spent 37 minutes a day on games and computer use for leisure, and 35 on in-person socializing. It is the first such year in the 22 years since the US Bureau of Labor Statistics began running its time-use survey. In 2004 the ratio was 21 minutes to 46. Television has not changed in those 22 years: 2.6 hours a day then and now. Total free time has not changed either: 5.1–5.4 hours. People did not gain more leisure. They moved it from the street to the screen.
This article is not about “screens killing socializing”. The position is harsher and more precise. The evening out lost not to screens but to its own price — money, travel, coordination and fatigue against zero at home; and socializing has not disappeared, it has moved into games, voice chats and streams. Below are five independent data series that show the same movement, and 11 charts.
01 · Five facts that do not depend on each other
Each claim below rests on its own data series and its own source. None follows from another, and all point in the same direction.
- Time at home is rising, in-person socializing is falling — and the trend is older than COVID. US: socializing 47 → 35 min/day (2003–2025), time at home +1 h 39 min/day (2003–2022). Europe: in-person socializing −6…−45% over 2010–2020 in nine countries.
- Games are growing in exactly the groups where socializing is falling. US, ages 15–19: games and computer use 47 → 92 min/day (2006–2025), socializing 55 → 38. Europe: time spent gaming rose 1.5–4 times over the decade.
- Fewer people drink, and they do not drink at the bar. US: 54% of adults drink (a low since 1939). England and Wales: alcohol in bars and restaurants −19% over 2017–2024. Germany: beer −6% in 2025, the biggest fall since 1993.
- Late-evening infrastructure is shrinking; early-evening infrastructure is not. Britain: clubs −36%, bars +3%. Berlin: drinks’ share of club revenue 60% → 20%. US: the number of bars did not change over 2019–2024, and concerts set a record.
- Money and time are flowing home. DoorDash ×12, Uber Delivery ×6, share of workdays done from home 7% → 26%. 73% of Americans aged 18–29 call “staying home” their default weekend plan.
02 · US: in-person socializing −26%, games almost ×2, 99 more minutes at home
The fall in socializing began long before smartphones: 47 minutes in 2003, 42 in 2010, before half of Americans even had an iPhone. Then 38 minutes in 2019 and 34–35 from 2021. The share of people who socialized with anyone in person on a typical day fell from 40% to 30%. There was no recovery after COVID: 2021–2025 is a plateau at the lowest level in the series.
Games and computer use for leisure almost doubled over the same period: 21 minutes in 2004, 25 in 2015, 37 in 2025. Television stood still — 2.6 hours a day in 2003 and the same in 2025; in BLS statistics, streaming simply took the place of cable. So the shift is not into “screens in general” but specifically into the interactive screen.
The rest of the American evening has moved indoors too. Sociologist Patrick Sharkey calculated on the same data that from 2003 to 2022 time at home grew by 99 minutes a day, and in the 15–24 group by 124 minutes; every extra hour at home means 5 minutes less with friends and 21 minutes more alone. Transport researchers at UCLA and Clemson gave a second cut: out-of-home activities fell by 51 minutes a day over 2019–2023. The share of time spent alone rose from 43.5% in 2003 to 48.7% in 2019 — before the lockdowns. Time with friends in person fell from 60 minutes a day in 2003 to 34 in 2019.
The most precise account of what exactly disappeared came from a study by Neal Caren in Socius (2026, 243,000 ATUS diaries). Time with friends over 2003–2024 fell by more than half. On Friday evenings in 2022–2024, 8% of adults saw friends, against 17% in the early 2000s; more than 80% of the loss is not shorter meetings but people who did not go out at all. The fall is the same at home, at friends’ places and in bars: the mix of activities did not change — the evening with people itself vanished. Caren dates the break to the mid-2010s.
The shift is sharpest among the young. In 2025 teenagers aged 15–19 spent 92 minutes a day on games and computer use — more than any other age group — and 38 minutes on in-person socializing. In 2006 it was 47 versus 55. Ages 20–24: games 28 → 65 minutes, socializing 55 → 31. The 25–34 group follows the same pattern, only more mildly.
One caveat, which supports the thesis rather than undermining it. ATUS codes chats, social networks and video calls as “computer use for leisure”, and playing online with friends as “games”. So in American statistics the migration of socializing online is invisible by definition: it looks like one line falling and another rising. European data close this gap.
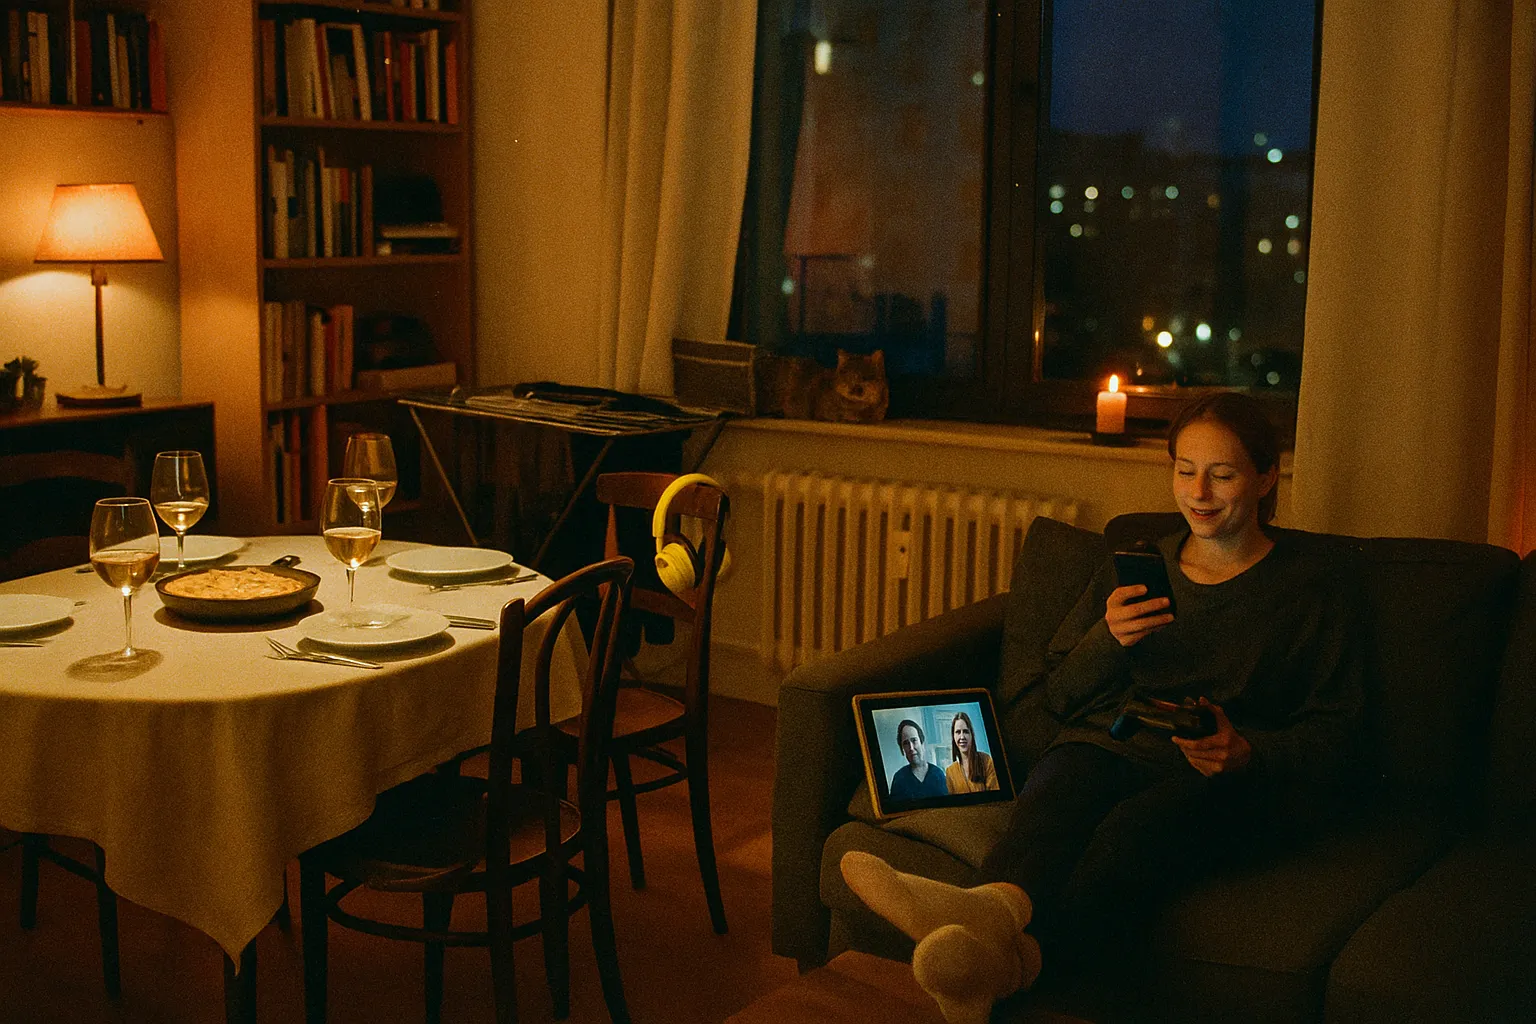
The table is set; the friends texted “next time”. More than 80% of the lost Fridays are not shorter evenings but people who did not go out at all.
03 · Europe: games ×1.5–4, in-person socializing down, “virtual” a new line
The Harmonized European Time Use Survey (HETUS) has been run twice — in the 2010 and 2020 waves. In all nine countries present in both waves, time spent on video games rose: Norway 8 → 23 minutes a day, Finland 7 → 19, Germany 8 → 17, Estonia 3 → 12, Austria 5 → 12, the Netherlands 7 → 12. Among 15–24-year-olds in 2020: Finland 64 minutes, Norway 58, Germany 51. This is the most robust fact in the whole study: it does not depend on country, taxes or the price of beer.
German national statistics confirm it separately: computer and electronic games — 1 h 09 min a week in 2012/13 and 2 h 10 min in 2022; among 10–17-year-olds, 67 minutes a day, among boys 106. Television and streaming together: 14:27 → 14:47 hours a week, so unchanged. Destatis states plainly that the structure of the average German’s day over ten years is “almost identical” — only what leisure time is spent on has changed.
In-person socializing fell everywhere except Hungary: Finland 49 → 27 minutes, Poland 45 → 28, Norway 80 → 54, Austria 65 → 44, Germany 60 → 45. Part of the fall is a change of definition: in 2010 “social life” included telephone conversations; in 2020 Eurostat split out “virtual social life” as a separate line. And that line is large: 23 minutes a day in Germany and Norway, 20 in the Netherlands and Finland. Add in-person and virtual together and German social time over ten years did not fall but rose: 60 → 68 minutes; Dutch, 60 → 73. Among young people in-person socializing fell in eight of the nine countries (Finland −50%, Poland −35%, Norway −37%), and virtual socializing closed most or all of the gap.
This is the central fact: in Europe socializing has not disappeared, it has changed channel. Polish statistics give the same conclusion in smaller numbers: time on social life, entertainment and culture was 71 minutes a day in 2013 and 64 in 2023, with 15–24-year-olds down 8–9 minutes.
04 · Alcohol: fewer people drink, and they do not drink at the bar
Gallup has asked Americans the same question since 1939. In 2025, 54% of adults answered “yes, I drink” — the lowest in the whole series; in 2026, 54% again. As recently as 2023 it was 62%. In the 18–34 group: 60% in 2021, 50% in 2025 — young people are now less likely to drink than people aged 55+. Average number of drinks per week among those who drink: 5.1 in 2003, 2.8 in 2025, 3.2 in 2026. And what matters most for the future: 53% of Americans in 2025 think that one or two drinks a day harm health; among 18–34s, two-thirds. In 2001–2011 a quarter thought so.
This is not an American peculiarity. In England the share of adults who did not drink alcohol in the past year rose from 17% (2011) to 24% (2024); among 16–24-year-olds about a third do not drink — 36% of men and 28% of women. Sales show where exactly the alcohol went: in England and Wales, the volume of pure alcohol sold per adult in bars and restaurants fell from 2.7 to 2.2 liters over 2017–2024 (−19%), and in shops from 6.6 to 5.9 (−11%). British beer moved from the pub to the supermarket even earlier: 80% of volume was sold in venues in 1990, 49% in 2015.
Germany: 125.6 liters of beer per head in 2000, 88 in 2024; in 2025 sales fell 6% — the most since 1993, when the series began. Poland: 85.9 liters per head in 2024, 81.7 in 2025, sales −5.5% according to NielsenIQ; production 39.7 → 34.6 million hectoliters over 2019–2024. Ukraine: in a WHO and KIIS survey at the end of 2023, 21.5% of adults said they had started drinking less after February 2022 and another 6.8% had quit; consumption had already fallen 26% over 2010–2019, before the war.
Berlin showed what this does to nightlife venues. Clubcommission surveyed 102 clubs in 2026: the share of tickets in revenue rose from 21% (2017) to 59%, and the share of drinks fell from roughly 60% to 20%; clubs that at least break even are now 61%, against 79%. Guests come, but they drink less and leave earlier — and the club model always stood on bar margin. What breaks it is not the screen but sobriety.
05 · Nightlife: the late format is dying, not going out
Britain has the best venue statistics. There were 1,240 nightclubs in March 2020 and 835 in November 2024; as of June 2026, NTIA puts the figure at −36% against the pre-pandemic level. 26% of towns that had at least one club now have none. The entire late-night economy (clubs, late bars, casinos) shrank by 29%; all licensed venues shrank by 14%. Bars are the only segment that grew: +3%, 4,695 venues at the end of June 2026, with 515 openings in a year. Pubs have been shrinking for 25 years in a row: 60,800 in 2000, 44,650 in 2025, a quarter gone.
Inside venues, the evening has shifted too. Only 6.7% of British venue sales come after 22:00; the largest share is 17:00–19:00 (25%). In the US, the share of restaurant guests who sit down between 14:00 and 17:00 doubled from 5% to 10% over 2019–2023; 18:00 became the most popular booking slot. The reasons guests themselves give are travel (30%) and safety (27%). Barclays recorded −3.6% in bar, pub and club transactions in May 2026, year on year; 44% of Britons went out less often in 2025, and 51% of those aged 18–34.
What is not dying matters just as much. The number of US bars (NAICS 722410) did not change over 2019–2024: 42,912 and 42,624, with employment above the pre-pandemic level. Live Nation held concerts for 159 million attendees in 2025, +5% on the year, with the same number of events: bigger stadiums, not more evenings. US restaurant traffic in 2025 was −0.3%. US fitness clubs have 81 million members, and visits are higher than in 2019. Cinemas fell: Britain 176 → 124 million tickets over 2019–2025, Germany 119 → 92 million.
Taken together, this gives a more precise formulation than “people aren’t going out.” The late, long, alcohol-centerd format of the evening is disappearing. People go out earlier, more sober, less often, and to bigger, planned events.
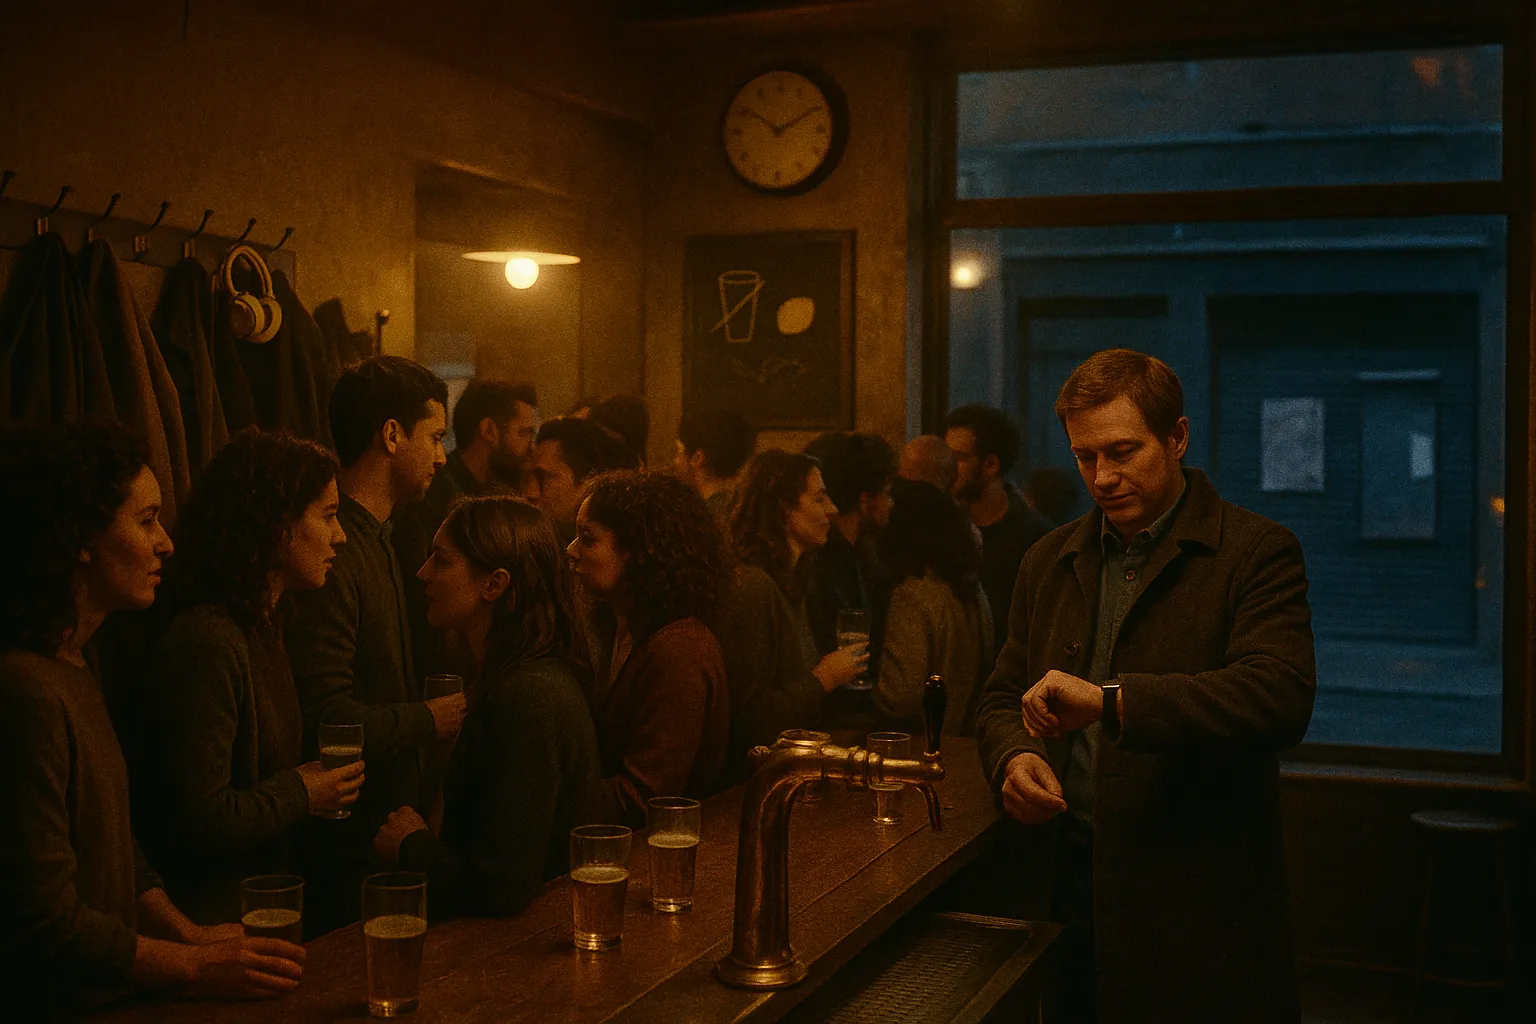
After 10 pm, British venues make 6.7% of their sales. The bar’s best hour is now 7 pm, and its best drink has no alcohol in it.
06 · Home as the default: delivery ×12, working from home ×3.6
DoorDash is the cleanest series, because it is audited reporting: 263 million orders in 2019, 816 million in the Covid year of 2020, 3.17 billion in 2025; order volume $8 billion → $102 billion. Uber Delivery: $14.5 billion → $90.9 billion. Instacart: 171 million orders in 2020, 339 million in 2025. Part of this growth is acquisitions (Wolt, Deliveroo, Postmates) and retail product lines, not only restaurants. But the structure of restaurant traffic changed even without them: in full-service US restaurants, the share of takeaway orders rose from 19% to 30% over 2019–2024.
Work stayed at home too: 7% of paid days in 2019, 48% in 2020, 26% in 2026. That is a plateau since 2023, but 3.6 times the pre-pandemic level. It removes the “after work” ritual, the most stable reason for an evening in the city center.
What people themselves say: in a Harris Poll survey in June 2026 (603 Americans aged 18–29), 73% name “staying home” as their default weekend plan, 74% spend at least half their weekends at home, and 68% agree that going out is “not worth the damage to the wallet.” 66% meet friends online at least every other weekend, on Discord, FaceTime and Zoom, and only 44% go to bars or clubs as often. At the same time, 60% say they would rather meet in person. This matters: people describe the move online as a compromise, not a choice.
An honest correction for Europe. Delivery is not growing here: Just Eat Takeaway had 1,012 million orders in 2022 and 879 million in 2024, Deliveroo grew +2% in 2024, Delivery Hero +0.9% in 2025. In Britain, takeaway food rose in price more than any other category (+41% over 2019–2025), and its transactions are falling fastest (−5.7%). The exception is Ukraine: Glovo reports +30% orders for 2024 and +29% for the first quarter of 2025, and quick delivery from shops grew from 17% to 28% of the business. The Kyiv curfew closed the evening at midnight until September 2026, and clubs moved to daytime parties. So in Europe, “home as the default” rests on time and alcohol, not on couriers.
07 · Where socializing moved: Roblox, Discord, Steam
Peak concurrent users on Steam grew from 9.5 million in 2015 to 43.5 million in October 2026. The share of those actually in a game at that moment has not changed: about 31% in 2020, 2024 and 2026. The rest are in chat, in the store, or simply logged in. So Steam is not only games, but also a room where people sit.
Roblox is the most direct example of a “third place” that has moved. 13.7 billion hours in 2019, 123.9 billion in 2025; 127 million daily users at 2.7 hours a day. 27% of the audience are adults; in the US in the second quarter of 2026, daily users aged 18–34 grew by 42% and their hours by 37%. Discord reports more than 200 million monthly active users and 2 billion hours of gaming through the platform every month. The role of these spaces is social by definition: according to Pew, 85% of American teenagers play games (72% in 2014), 89% of players play with others, 47% made a friend through games, and 72% play to “spend time with others.” Among adults, according to the ESA, 78% of players met people through games whom they would otherwise not have met.
Streaming in this story is not the engine but a substitute. Streaming’s share of US TV viewing rose from 26% in May 2021 to 48.6% in May 2026, but total time in front of the television is not growing: in BLS data it has been flat since 2003, and Netflix viewing hours added only 8% in two and a half years. Streaming ate cable, not the evening.
And one more correction, stronger than the usual thesis that “gaming is growing.” Since 2021, time spent in games on individual platforms has not grown: PlayStation −4% on the year despite a record 125 million users, Newzoo records −1% in total time on PC and consoles in 2025, and Twitch has lost a fifth of its hours since 2021. The precise formulation: the home evening settled at the Covid level and did not roll back. The base grew, time hit a plateau, and a plateau that does not roll back is the new default.
08 · Price: going out is getting more expensive faster than staying in, but not by enough to explain everything
Over 2019–2025, food away from home in the US rose by 34% against general inflation of 26%, alcohol in bars by 25%, and alcohol at home by 12%, while home electronics got 18% cheaper. In Britain, restaurants and cafes rose 33%, cinema and concerts 27%, games and hobbies 9%; a pint of lager went from 370 to 477 pence (+29%) against inflation of +24%. Poland is the sharpest case in the EU: restaurants +75% over 2019–2025 (Eurostat index). A London evening of two pints, the Tube, club entry and a taxi costs 50% more in real money than in 1995.
Subscriptions at home have also gone up, Netflix $12.99 → $19.99 and Game Pass Ultimate $19.99 → $29.99, but the price here is per month, not per evening. The marginal cost of an hour of a home evening is close to zero, and prices of new games on Steam even fell over 2023–2025: the median of the top-50 releases went from $19.50 to $15.64.
Why price does not explain everything. Elasticity studies give −0.34 to −0.46 for beer in venues: a price rise of 25–35% explains a 9–15% fall in volume, not 19–36%. Alcohol in bars did not get more expensive faster than inflation in either the US or Britain. So money price is a strong co-author for restaurants and clubs and a weak one for alcohol. The stronger variable is costs that are not measured in money: travel, coordination, safety, fatigue, and the fact that an evening at home requires none of them.

The courier carries dinner into a building where every window glows with its own screen. The third place did not disappear; it just no longer has an address.
09 · AI: the next layer — replacing the conversation partner, while it’s still 2–4%
ChatGPT has 900 million weekly users (February 2026); the share of non-work messages rose from 53% to 73% in a year. But relationships and reflection account for 1.9% of messages, and role-play for 0.4%. At Claude, affective conversations are 2.9% and companionship is under half a percent. Pew, February 2026: half of American adults use chatbots, 10% for emotional support, 4% as a companion. The narrow segment looks different: 72% of American teens have tried an AI companion, 52% use one regularly, 13% daily, and 31% say talking to it is at least as satisfying as talking to a friend. A Character.AI user spends 70–80 minutes a day in the app — according to the company itself.
What this means for the thesis. The decline in face-to-face socializing began 20 years before ChatGPT, so AI is not the cause but a forward signal: the first screen that replaces not leisure but the conversation partner. A four-week experiment by MIT and OpenAI (981 participants) found that heavy daily use is linked to greater loneliness and less contact with people. But the effects are small, and the direction of causality is not proven: lonely people use bots more. There is no time-of-day data for companion apps, so the thesis of “evening conversations with AI” remains an assumption.
10 · Causal model: what explains what
| Factor | Mechanism | Strength of evidence | What it explains best |
|---|---|---|---|
| Sobriety | Fewer drinkers and fewer servings break the bar margins of clubs and pubs | High | Clubs, pubs, Berlin; ages 18–34 |
| Zero marginal cost of home | Games, streams and voice chats need no money, travel or coordination for an extra hour | Medium (synchronicity, not causation) | Growth of gaming in all countries, plateau after 2021 |
| Cost of going out | Restaurants, cover charges and taxis get more expensive faster than inflation; alcohol does not | Medium | Restaurants, late formats; not alcohol |
| Non-monetary friction | Travel, safety, time: 30% and 27% of UK guests cite them as the reason for leaving early | Medium (self-reported) | Shift of the evening to an earlier hour |
| COVID hysteresis | Closed venues did not return, habits set | Medium | The 2020–2021 step down and the absence of a rebound |
| Working from home | No "after work" in the city center; 26% of days at home | Medium | Weekday evenings, after-work |
| AI companions | Replacing the conversation partner, not leisure | Low | Teens; 2–4% of adults — forward signal |
11 · Consequences: city, venue, person
For cities. The night-time economy is not returning to its 2019 format. Municipal club rescue programs built on the bar model save a model that no longer exists. Berlin showed this: 74% of clubs depend more and more on grants, even though grants provide only 2% of revenue. What works is early formats, daytime events and a safe way home — exactly what guests name as the reason for leaving earlier.
For venues. The winner is the one who sells an event, not alcohol: tickets, food before 21:00, sports broadcasts, a non-alcoholic menu. British bars are growing in the same market where clubs are closing. The late slot after 22:00 brings in 6.7% of sales — it can no longer carry the rent.
For people. Social time has stopped happening by itself. An evening with friends is no longer a default you slide into from work, but an event you have to design: the day, the place, who picks up whom. We have already written about this from another angle — how attention is captured by those who design the environment, and why closeness needs a delivery system, not a mood. If your default evening is a screen, at least make it social: a voice channel and a co-op game hold a connection better than a feed; here are 20 strategies that fit in 15 GB.
Sources
- BLS, American Time Use Survey: 2025 release, Table A-1 by year, release archive with Table 11, code lexicon
- Sharkey P., Homebound: The Long-Term Rise in Time Spent at Home Among U.S. Adults, Sociological Science, 2024
- Morris, Speroni, Taylor, Going Nowhere Faster, JAPA — press release
- Atalay E., Time Alone, Philadelphia Fed WP 22-11
- Kannan, Veazie, US trends in social isolation, SSM Population Health, 2023
- Caren N., The End of Friday Nights with Friends, Socius, 2026 (abstract; recap in Marginal Revolution)
- Eurostat HETUS: tus_00age (2010), tus_20age (2020); own calculation via the API
- Destatis, Zeitverwendungserhebung 2022 vs 2012/13, games by age
- GUS, Budżet czasu ludności 2023
- Gallup: 2025, 2026, trend since 1939
- Health Survey for England 2024 via Drinkaware; Public Health Scotland, on-/off-trade sales
- Destatis, beer sales 2025; Deutscher Brauer-Bund via Statista
- WHO Europe, Ukrainians are drinking less alcohol; WHO GHO, per capita consumption
- NTIA: clubs −32.7%, 2026 monitor; BBPA via Morning Advertiser
- Clubcommission Berlin, Clubkultur Berlin 2026
- BLS QCEW, NAICS 722410; Live Nation, 10-K 2025; Circana, foodservice 2025; Yelp via Food Institute; Barclays, May 2026
- DoorDash 10-K 2025, 10-K 2020; Uber 10-K 2025; Instacart 10-K 2025; Just Eat Takeaway FY2024; Deliveroo FY2024; NRA, off-premise
- WFH Research, SWAA monthly; Harris Poll, Gen Z Weekend Report, July 2026
- Roblox 10-K 2025, Q2 2026; SteamDB via icon-era; Discord, 2025 press release; Pew, Teens and Video Games Today; ESA, Essential Facts 2025
- Nielsen The Gauge: May 2025, May 2026; Stream Hatchet, 2025; Netflix, What We Watched H1 2026
- CPI: BLS via FRED (SEFV, SEFX, SEFW); ONS MM23, pint price CZMS; Eurostat prc_hicp_aind; HMRC, alcohol elasticities; Time Out, price of a night out in London
- OpenAI/NBER, How People Use ChatGPT; Anthropic, affective use of Claude; Pew, Americans and AI 2026; Common Sense Media, Talk, Trust, and Trade-Offs; MIT Media Lab / OpenAI, RCT
- Bauernschuster, Falck, Woessmann, Surfing Alone?, J. Public Economics, 2014
Frequently asked
Have games really “overtaken” socializing, or is this a numbers trick?
According to the American Time Use Survey, in 2025 the average American aged 15+ spent 37 minutes a day on “games and computer use for leisure” and 35 minutes on “socializing” (in person, excluding calls and chats). In 2004 it was 21 versus 46. This is a first in the 22-year series, but the BLS games category also includes social media, so “overtaken” refers to interactive screens in general, not just video games.
Are people really drinking less, or just saying they drink less?
Both, but the stronger evidence is sales. In the US, Gallup records 54% of adults drinking in 2025 and 2026 — the lowest since 1939. In England and Wales, the volume of alcohol sold in bars and restaurants fell 19% over 2017–2024, and in shops 11%. In Germany, beer sales fell 6% in 2025, the most since 1993. A counter-example is Bulgaria: per-capita consumption, according to WHO data, is still rising.
If clubs are closing, why are bars and concerts growing?
Because what is disappearing is not going out but its late, long, alcohol-heavy format. In Britain there have been 36% fewer nightclubs and 3% more bars since March 2020; only 6.7% of venue sales fall after 10 p.m. Live Nation sold tickets to 159 million fans in 2025, a record. People go out earlier, more soberly, less often, and to bigger events.
Is it all down to prices?
Partly. Food away from home in the US rose 34% over 2019–2025 against 26% general inflation; in Poland restaurants rose 75%. But alcohol in bars did not get more expensive faster than inflation, and elasticity estimates explain only 9–15% of the fall in volumes. The rest is costs that money does not measure: the journey, coordination, safety, and the fact that an extra hour at home costs nothing.
Are AI companions already pulling people away from real-life socializing?
Not yet, at scale. In ChatGPT, relationships and role-play make up about 2.3% of messages; in Claude, affective conversations are 2.9%. But 13% of American teenagers talk to an AI companion every day, and a Character.AI user spends 70–80 minutes a day in the app. The decline in in-person socializing began 20 years before ChatGPT, so AI is not the cause but the next layer: it replaces not leisure but the conversation partner.
Comments
Signed-in readers only — to keep it human, not a bot swamp.